
Customer Churn: Definition, Churn Rate Formula, and What It Costs You
Every service business loses customers. That part is normal. What is not normal is how few operators can tell you, to the dollar, how many customers they lost last quarter.
Customer churn gets talked about constantly and measured almost never. So here is the plain version: what customer churn is, how to calculate churn rate — monthly versus annual, headcount versus revenue — what causes churn in a business where nobody actually cancels anything, what it costs per location and across a portfolio, and what to do with the number once you have it.
What Is Customer Churn?
Customer churn is the percentage of customers who stop buying from you over a defined period. Attrition means the same thing. Retention is the same number viewed from the other end. That is also how Harvard Business Review defines churn rate: the share of customers who end their relationship with a company inside a given window.
The definition is easy. Applying it to a service business is where it gets uncomfortable, because most of your customers never formally leave.
A software company knows the exact moment a customer churns. They cancel, the billing stops, a number turns red on a dashboard somewhere. A wax center, a hair salon, a chiropractic clinic, a dental practice: nobody cancels. They just stop booking. There is no cancellation event and no exit survey. There is only silence, and silence looks exactly like a client who is merely overdue.
That ambiguity is the entire problem. If you cannot see churn you cannot price it, and if you cannot price it you will keep buying new customers to replace the ones you already had.
Contractual Churn vs. Non-Contractual Churn
Contractual churn happens wherever there is a subscription or membership. Gym memberships, wellness plans, unlimited packages, retainer agreements. The customer has to actively cancel, so you get a clean signal and a clean date.
Non-contractual churn happens everywhere else. Pay-per-visit salons, dental practices, med spas, pet groomers, home services. The customer cancels nothing. They simply do not come back.
Most multi-location operators run both models at once, which is why their churn reporting is usually a mess. The membership side gets tracked because billing forces the issue. The pay-per-visit side, often the larger revenue base, gets tracked by nobody.
Voluntary Churn vs. Drift
Cutting the same base a different way: some clients leave on purpose, and some just drift.
Voluntary churn is a conscious decision. The client had a bad visit, found a cheaper option, or moved on, and would tell you so if you asked. Reversing it means understanding and addressing the cause.
Drift is everything else. The client got busy, broke the routine, forgot, and never made a decision at all. In our experience working lapsed lists for service brands, drift describes the majority of the file — and drifters are the highest-probability reactivation targets precisely because there is nothing to fix. They are waiting to be asked back.
Churn, Lapsed Customers, and Attrition
Churn is a rate. It describes a group of customers over a period of time, expressed as a percentage. Attrition is a synonym for it, used mostly in dental and healthcare.
A lapsed customer is a person. One individual who has crossed your inactivity threshold and has not rebooked.
Customer retention rate is churn viewed from the other side. If annual churn is 55%, annual retention is 45%. Report either one, but pick one and stay with it, because switching between them halfway through a board deck is how everyone ends up confused.
Churn Rate: How to Calculate It
Churn rate = (customers lost during the period / customers at the start of the period) × 100The formula is short enough to memorize. All the difficulty lives in the inputs, not the arithmetic: what counts as “lost”, who belongs in the denominator, and what period you are measuring over. This section works through each of those decisions, because a churn rate calculated sloppily is worse than no churn rate at all — it gives you false confidence in a number that will not survive contact with the CRM.
A Worked Example
One location. You start Q1 with 2,000 active clients. During the quarter, 300 of them cross your lapse window and never rebook.
(300 / 2,000) × 100 = 15% quarterly churnTwo rules keep this number honest.
First, do not count customers you acquired during the quarter in the starting figure. They belong in next quarter’s denominator.
Second, do not annualize by multiplying by four. Churn compounds against a shrinking base, so the annual figure is:
1 - (1 - 0.15)^4 = 47.8% annual churnNot 60%. That twelve-point gap is the difference between a panic meeting and a plan.
Monthly vs. Annual Churn Rate
The same relationship holds between monthly and annual figures, and it trips up more operators than any other part of the calculation.
Membership businesses — gyms, boutique fitness, med spa memberships, wellness plans — usually measure monthly churn, because billing runs monthly and cancellations arrive monthly. Pay-per-visit businesses are better served by quarterly or annual windows, because a single month is too short to distinguish a lapsed client from one who is simply between visits.
To convert a monthly churn rate to an annual one, compound it — never multiply by twelve:
Annual churn = 1 - (1 - monthly churn)^12A 5% monthly churn rate is not 60% annually. It is:
1 - (1 - 0.05)^12 = 46.0% annual churnThe same math runs in reverse. If a location reports 50% annual churn and you want the monthly equivalent for pacing a recovery campaign, solve for the monthly rate: about 5.6% per month. Small monthly numbers hide large annual ones, which is why a membership business that shrugs at “only 6% monthly churn” is actually losing the majority of its member base every year.
One practical rule for multi-location reporting: pick one period and standardize it across every location. A dashboard where Location A reports monthly churn and Location B reports annual churn is not a dashboard, it is an argument waiting to happen.
Logo Churn vs. Revenue Churn
Customer churn counts heads — in SaaS vocabulary, “logo churn”. Revenue churn counts dollars.
Revenue churn rate = (revenue lost from lapsed customers / revenue at the start of the period) × 100The two numbers diverge, sometimes badly. A med spa that loses 40 clients mid-treatment-plan has a small customer churn figure and a brutal revenue churn figure. A wax center that loses 200 pay-per-visit clients has the reverse. Track headcount only and you will point your recovery effort at the wrong list. Track both, and prioritize by revenue.
A worked example makes the divergence concrete. Illustrative numbers:
- A location starts the quarter with 1,000 active clients generating $150,000 in quarterly revenue.
- It loses 100 clients: logo churn is 10%.
- But 30 of those 100 were high-frequency members averaging $600 per quarter, and the other 70 averaged $80. Revenue lost: (30 × $600) + (70 × $80) = $23,600.
- Revenue churn: $23,600 / $150,000 = 15.7%.
Same quarter, same location: 10% by heads, nearly 16% by dollars. Whenever revenue churn runs ahead of logo churn, your best clients are leaving faster than your average ones — and that is the single most urgent pattern a churn report can surface.
Gross vs. Net Revenue Churn
Once you track revenue churn, one more split matters: gross versus net.
Gross revenue churn counts only the losses — revenue that walked out with lapsed clients and downgrades, ignoring everything gained. Net revenue churn subtracts expansion revenue from existing clients: upgrades from single services to memberships, added service lines, increased visit frequency.
Net revenue churn = (revenue lost - expansion revenue from existing clients) / starting revenue × 100If existing clients expanded by more than lapsed clients took away, net revenue churn goes negative — the existing base grew on its own, before counting a single new customer. SaaS companies chase negative net churn obsessively; service operators rarely even compute it, but the concept translates directly. A salon client who moves from a cut every eight weeks to cut-plus-color every six is expansion revenue. So is a dental patient who adds an aligner case, or a fitness member who upgrades from eight classes a month to unlimited.
Report both. Gross churn tells you the size of the leak. Net churn tells you whether the base is growing or shrinking after your existing clients’ behavior is netted out. A healthy net figure can hide an ugly gross figure — and the gross figure is the one your reactivation campaign gets pointed at.
Common Churn Rate Calculation Mistakes
The formula is simple; these are the ways it goes wrong in practice.
- Counting new customers in the denominator. Adding mid-period acquisitions to the starting count dilutes the rate and flatters the result. The denominator is the count at the start of the period, full stop.
- Multiplying instead of compounding. Covered above, worth repeating: monthly × 12 or quarterly × 4 overstates annual churn, sometimes by ten points or more.
- Measuring only the membership side. Billing systems make contractual churn easy to see, so it becomes the only churn that gets reported — while the pay-per-visit base, often larger, churns invisibly.
- No defined lapse window. Without an explicit inactivity threshold, “customers lost” is whatever the person building the spreadsheet feels like that day. The number becomes non-comparable between months and between locations.
- Changing the lapse window and comparing across the change. Tightening the window from 90 days to 60 will make churn jump with no change in client behavior. Recalculate history when you change the definition, or annotate the break.
- Ignoring seasonality. Comparing a January churn figure to a July one in a fitness business tells you about the calendar, not the business. Compare periods year over year.
- Treating one blended number as the answer. A single portfolio-wide churn rate hides the two things you most need: which locations leak worst, and which client segments leave fastest. The blended rate is the headline; the segmented rates are the operating report.
What Counts as a “Good” Churn Rate?
There is no universal good churn rate, and any resource that hands you a single number to aim for is skipping the part that matters. What a defensible churn rate looks like depends on:
- Business model. Contractual membership businesses should run far lower churn than pay-per-visit businesses, because cancellation requires a decision instead of mere drift.
- Visit cadence. A wax center on a four-week cycle gives clients twelve chances a year to break the routine; a dental practice on a six-month recall gives them two. More cycles, more break points, higher natural churn.
- Price point and discount exposure. Bases built on introductory offers churn faster than bases built at full price, because a meaningful share of the file was never buying the service — they were buying the discount.
- Client tenure mix. A location that grew fast recently carries a high share of first- and second-visit clients, the segment most likely to lapse. Its churn rate will look worse than a mature location’s without being worse-run.
- Measurement window. The same business shows very different churn at 60, 90, and 180-day lapse definitions. A rate is only comparable to another rate calculated the same way.
So the honest answer to “what should my churn rate be” is: lower than it was last quarter, measured the same way. Benchmark against your own history and your own best-performing locations first, and use industry ranges — like the vertical table later in this post — only as directional context.
How to Define “Lapsed” When Nobody Cancels
Since your clients never announce their departure, you have to decide when they are gone. This is a business decision, not an accounting one, and it should come from your own booking data.
Pull the distribution of days between visits for your active clients, find the median, and set the lapse window just past the point where the rebooking curve flattens. In practice it lands around here:
- Wax centers: four to six weeks
- Hair color: six to eight weeks
- Massage and boutique fitness: three to four weeks of inactivity
- Chiropractic: three to four weeks
- Dental hygiene recall: six to nine months
The window matters more than it looks, because it is not only a reporting threshold. It is an operational trigger. Our own campaign data, collected in the customer churn statistics, shows phone reactivation rates of 25% to 40% when a client is called three to four weeks after their last visit. Wait until the six-month mark and that falls to somewhere between 2% and 5%.
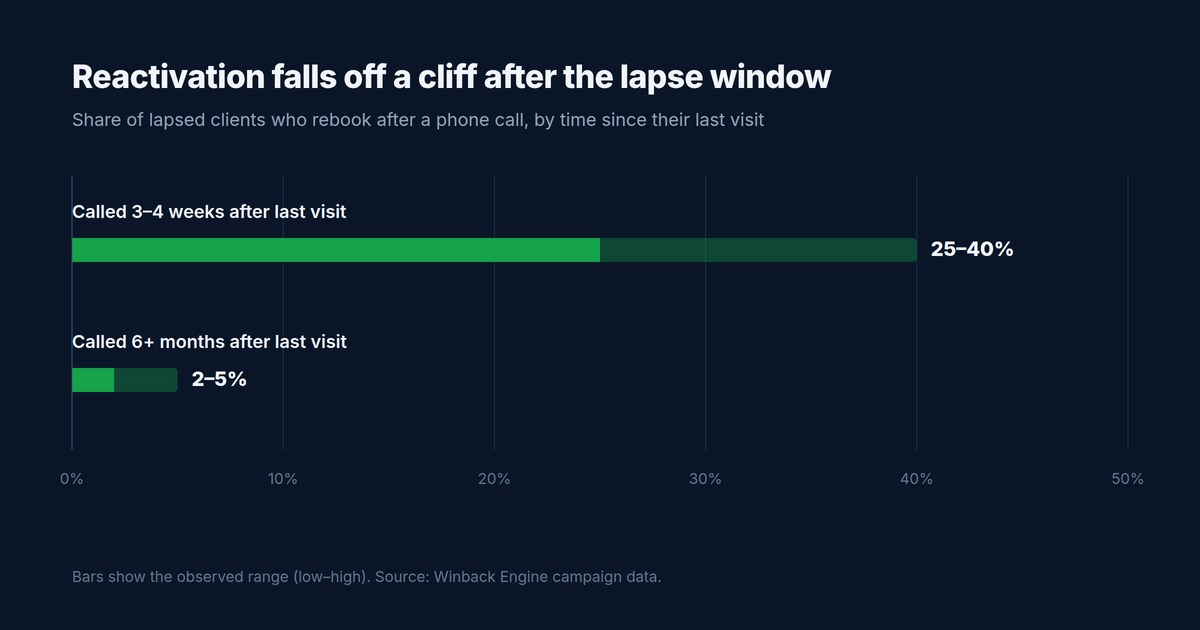
The customer has not changed in those six months. Their memory of you has. Which is why recovery campaigns should start when the lapse window trips, not at the twelve-month mark — every month of delay costs recovery rate.
What Actually Causes Customer Churn in Service Businesses
Ask an operator why clients leave and you will hear price, competition, or the economy. The data rarely agrees.
The most common cause is that nobody rebooked them at the counter. The client finished their appointment, said they would call, and walked out without a next date. That is not a loyalty problem. That is a checkout problem, and it is fixable this week.
The second cause is life. People move, change jobs, get injured, take a summer off and never restart the routine. Not unhappy. Just out of rhythm.
Third is staff turnover, which is the leak nobody wants to discuss. When a stylist, hygienist, or trainer resigns, a chunk of the book leaves with them, because the relationship was with the person and not with your brand.
Fourth is quiet value drift. A membership renews at a higher rate, or a service gets ten minutes shorter, or one visit goes badly. The client says nothing at all. They just stop coming.
And running underneath all of it: nobody followed up. Somewhere between 60% and 65% of service business clients never return after their first or second visit, and almost none of them made a conscious decision to leave. Which is the uncomfortable, useful truth about this whole category. Your lapsed clients are not gone; most are one well-timed contact away from rebooking, and most of them will never generate that reason on their own. Our complete guide to customer reactivation covers what that contact looks like.
What a Normal Churn Rate Looks Like
Annual churn varies enormously by vertical, which is why a generic benchmark is close to useless. Here is the range we see across the categories we work in:
| Industry | Annual churn | Avg. visit value | Reactivation potential |
|---|---|---|---|
| Wax centers | 60–70% | $50–80 | Very high |
| Massage and bodywork | 55–65% | $80–120 | Very high |
| Hair salons | 50–60% | $60–120 | High |
| Boutique fitness | 50–65% | $100–200/mo | High |
| Traditional gyms | 30–50% | $30–60/mo | Moderate |
| Dental practices | 20–30% | $150–300 | High |
| Med spas | 40–55% | $200–500 | Very high |
| Chiropractic | 35–50% | $50–100 | High |
| Pet grooming | 30–45% | $50–100 | High |
Treat these as directional. They come from Winback Engine’s aggregated campaign data alongside published industry association benchmarks, not a controlled academic study, and your own numbers will move with market, price point, and membership mix. One pattern holds throughout: the categories with the worst churn also have the best reactivation potential.
The Cost of Customer Churn
The visible cost of churn — one empty slot in the book — is the tip. The real cost stacks up in four layers, and it is worth walking through them because each one hits a different line of the P&L.
Lost lifetime revenue. When a client churns, you lose every future visit they would have booked, not just the next one. For a recurring-visit business, a client’s annual value is visit frequency times average transaction value, and their lifetime value is a multiple of that. Losing a client mid-relationship forfeits the whole remaining stream.
Wasted acquisition cost. You already paid to win that client — ad spend, an introductory discount, staff time. When they lapse before the relationship matures, that investment never pays back. In many verticals, a first-visit client acquired on a discount has not even covered their own acquisition cost yet.
Lost referrals. Active regulars refer. Lapsed clients do not, and the ones who left over a bad experience talk. The referral pipeline you never see is part of the bill.
Replacement cost. To hold revenue flat, every churned client has to be replaced with a new one at full acquisition cost. This is the churn treadmill: a growing share of the marketing budget goes to standing still. Acquiring a new customer costs five to seven times what reactivating a lapsed one does, and the new customer typically arrives on a discount and is less likely to return.
None of this is a new idea. Bain & Company’s research on loyal customer relationships put a number on it years ago: in financial services, a 5% increase in customer retention produced more than a 25% increase in profit. What has changed is that the lapsed list now sits inside your CRM, already segmented, waiting for someone to work it.
A Simple Framework for Pricing Your Own Churn
Skip the generic benchmarks and use your own data. Three steps:
- Count your lapsed clients. Pull from the CRM: everyone past the lapse window you set above.
- Calculate average annual client value. Total revenue from active clients divided by the number of active clients.
- Multiply. Lapsed clients × average annual value = annual churn cost.
If you want the same math run interactively against your own list size and ATV, the ROI calculator does it in about two minutes.
The Multi-Location and Franchise Angle
Single-location operators feel churn as a slow drain. Multi-location operators feel it as a compounding problem, for two reasons: scale and visibility.
A Hypothetical 10-Location Model
To make the scale point concrete, here is an illustrative model — assumed inputs, not a client case study:
- 10-location wellness franchise, 2,000 active clients per location
- Average transaction value: $100, at 6 visits per year
- Annual revenue per active client: $600
- Assumed annual churn rate: 60%
Per location, that is 1,200 clients lost and $720,000 in revenue gone per year. Across ten locations: 12,000 clients and $7.2 million annually. Plug in your own churn rate and ATV and the shape of the result rarely changes, only the magnitude.
Now run the recovery side of the same hypothetical. Suppose a phone campaign reaches half of those 12,000 lapsed clients and rebooks 30% of the ones reached — rates consistent with the phone-reactivation ranges in our churn statistics. That is 1,800 clients rebooked at $100 each: $180,000 in immediate revenue, and roughly $1.08 million in ongoing annual value if they resume a six-visit cadence. From a list you already own, with no ad spend and no discount margin given away.
The Visibility Problem
Churn does not show up as a line item on the P&L. There is no “revenue lost from lapsed clients” report in the monthly review. What you see instead is stagnant same-store sales, rising marketing cost against flat revenue, full books at some locations and half-empty ones at others. It gets blamed on seasonality, competition, or the economy.
And in a franchise system, every location has its own churn rate, its own lapsed list, and its own data silo. Location A might be losing 50 clients a month while Location B loses 120, but the corporate dashboard only shows aggregate revenue. The hidden cost is not just the lost revenue — it is the lost visibility. You cannot fix what you cannot see, which is why the first move for any multi-location operator is centralizing lapse reporting across the system. We work through that setup on our franchise page.
How to Reduce Customer Churn — and Recover From It
Prevention and recovery are different playbooks, and most operators fund the first while ignoring the second.
Prevention is about closing the leaks upstream: rebooking every client at the counter before they leave, tightening onboarding in the first 30 days, watching provider-level retention so a resignation does not take the book with it, and catching value drift before it compounds. The full playbook is in customer retention strategies that actually work for service businesses.
Recovery accepts that some churn is inevitable and works the lapsed list deliberately. Three steps, in this order:
Measure it. Set a lapse window per service line, run the churn rate formula against last quarter, and attach a revenue figure to the result. Most operators stop here, feel briefly terrible, and go back to running the business.
Segment it. Not every lapsed client is worth the same call. Sort by recency first, lifetime value second. Someone who lapsed four weeks ago with a $2,000 spend history is a different prospect entirely from someone who vanished eleven months ago after one discounted visit.
Contact it. And by contact, we mean the phone. Automated win-back email reactivates 1% to 3% of a lapsed list. A trained human agent on the phone reactivates 25% to 40%. That gap is not a rounding error, it is the entire business case. Our complete guide to customer reactivation walks through how the campaign is built, and if you are weighing recovery spend against acquisition spend, the head-to-head math is in customer reactivation vs. new acquisition ROI.
From Churn Measurement to Reactivation
Everything above ends in the same place: a number and a list. The number is your churn rate; the list is the lapsed clients behind it. Measurement is only worth the effort because that list is workable.
This is the practical difference between churn as an analytics exercise and churn as a revenue program. The churn rate tells the P&L story — how big the leak is and whether it is growing. The lapsed list is the asset: names, service history, spend history, and last-visit dates already sitting in your CRM, which makes reactivation the cheapest revenue channel most operators own and the only marketing channel where the audience already knows the brand. Every point of churn you recover through reactivation compounds the same way churn itself does, just in the right direction: a rebooked client resumes a visit cadence, not a single transaction.
If churn measurement is where this post ends, reactivation is where the work starts — the complete customer reactivation guide picks up exactly there.
Customer Churn FAQ
What is customer churn?
Customer churn is the percentage of customers who stop doing business with a company over a defined period. In service businesses, a client counts as churned once they pass a set inactivity threshold — the lapse window — without rebooking, since most clients never formally cancel; they simply stop booking.
How do you calculate churn rate?
Divide the number of customers lost during a period by the number of customers at the start of that period, then multiply by 100. Exclude customers acquired mid-period from the starting count. To annualize a monthly rate, compound it — annual churn = 1 − (1 − monthly churn)^12 — rather than multiplying by twelve.
What causes customer churn?
In service businesses the leading causes are operational, not competitive: clients leaving without a next appointment booked, life disruptions that break the visit routine, staff turnover that takes a provider’s book with them, and gradual value drift. Most lapsed clients drift away without ever making a decision to leave, which is why follow-up recovers so many of them.
What is the difference between churn, retention, and attrition?
Churn and attrition are synonyms: the share of customers lost over a period, with “attrition” more common in dental and healthcare settings. Retention is the same measurement inverted — the share of customers kept. A 40% annual churn rate and a 60% annual retention rate describe the same customer base.
What is a good churn rate?
There is no single good churn rate. A defensible target depends on business model (contractual vs. pay-per-visit), visit cadence, price point, client tenure mix, and how “lapsed” is defined. Benchmark against your own history and your best-performing locations, measured with a consistent lapse window, and treat published industry ranges as directional context only.
The Short Version
Churn rate is customers lost divided by customers at the start of the period, times one hundred. In a service business the hard part is deciding when a customer counts as lost, so set a lapse window from your own booking cycle and hold to it. Then pull the list and call it, ideally inside three weeks, because after that the odds fall off a cliff.
Here is the exercise. Open your CRM. Count the clients who have not visited in sixty days and multiply that by your average transaction value. That is your churn cost for the last two months alone. Now ask whether anyone in your organization is doing anything about it. For most operators, the honest answer is no.